
Do-It-Yourself Probeware
A Guide to Experiments With Inexpensive Electronics
Draft May 25, 2007

Robert Tinker
and the ITSI Team
The Concord Consortium
Copyright 2007
Table of Contents
Table
of Contents..................................................................................................................... 2
Introduction............................................................................................................................... 4
Why Probeware?.................................................................................................................. 4
Why Do It Yourself Probeware?........................................................................................ 4
About This Guide.................................................................................................................. 5
Summary of the Sections..................................................................................................... 6
Credits.................................................................................................................................... 7
Section 1: Safety........................................................................................................................ 8
Section 2: Basics....................................................................................................................... 10
Charge.................................................................................................................................. 10
Current................................................................................................................................. 11
Voltage................................................................................................................................. 11
Resistance............................................................................................................................. 12
Capacitance.......................................................................................................................... 13
Inductance............................................................................................................................ 14
Equivalent Resistance......................................................................................................... 14
Matching Outputs and Inputs........................................................................................... 15
Section 3: The Kit
Parts.......................................................................................................... 16
The Parts in the Kit............................................................................................................. 16
Mug Shots............................................................................................................................ 18
Section 4: Using the
DMM..................................................................................................... 21
Plug it in and Turn it On.................................................................................................... 21
Measuring Voltage............................................................................................................. 22
Measure Resistance............................................................................................................ 22
Test the Clip Leads............................................................................................................. 23
Trouble Shooting the DMM.............................................................................................. 23
Don’t Measure Current..................................................................................................... 23
Section 5: A First
Probe.......................................................................................................... 24
The Parts You Need........................................................................................................... 24
Overview............................................................................................................................. 24
The GoLink.......................................................................................................................... 24
The TMP36 Sensor.............................................................................................................. 26
The Experiment
Board...................................................................................................... 27
The Complete Circuit......................................................................................................... 27
Creating a Probe................................................................................................................. 29
Section 6: Three-Wire
Probes................................................................................................ 31
Magnetic Field..................................................................................................................... 31
Rotation................................................................................................................................ 32
Other Three-Wire Sensors................................................................................................. 34
The TDK relative humidity sensor................................................................................... 34
Section 7: Experiments
with Three-Wire Probes............................................................... 35
Temperature........................................................................................................................ 35
Map the Magnetic Field..................................................................................................... 35
A Pendulum......................................................................................................................... 35
Section 7: Half-Bridge
Circuits.............................................................................................. 36
What is a Half-Bridge?....................................................................................................... 36
Measuring Light with the Phototransistor..................................................................... 36
Measuring Force with Conductive Foam....................................................................... 37
Measuring Galvanic Skin Response................................................................................. 38
Section 8: Amplifier
Circuits.................................................................................................. 41
Voltage Amplifiers............................................................................................................. 41
Example: Thermocouple.................................................................................................... 42
Example: Small Magnetic Fields....................................................................................... 46
Current-to-Voltage Amplifiers......................................................................................... 46
Example: LED as Detector................................................................................................. 47
Section 9: Calibration............................................................................................................. 48
Overview............................................................................................................................. 48
Linear Probes...................................................................................................................... 48
Non-Linear.......................................................................................................................... 48
Section 10: Noise Reduction.................................................................................................. 49
What is Noise?.................................................................................................................... 49
Keeping Noise Out............................................................................................................. 49
The RC Filter....................................................................................................................... 49
Example: The Motion Detector......................................................................................... 50
 Introduction
This guide is designed for teachers who want to offer students the ability to undertake exciting, meaningful science experiments while also learning a bit of very useful electronics. It was developed for the Information Technologies for Science Investigations (ITSI) project at the Concord Consortium.
Why Probeware?
The ITSI project gives you access to the best and latest technology-enhanced materials for secondary science. The materials are classroom-tested, and research-based activities. They balance the use of real experiments using probes and virtual ones using computational models. This guide supports the “real” experiments used in the ITSI project.
It is important that every student have frequent lab experiences. Labs give students unique opportunities to focus on critical concepts and to understand how these concepts play out in real contexts. One of the most important goals of labs is to impart experimental skills that enable students to become increasingly independent so they can learn thing on their own.
One of the most valuable uses of computers in science education is as instruments that can sense, record, and display data in real-time. We invented the term “Microcomputer Based Labs” or MBL to refer to this kind of application, back when microcomputers were rare and amazing devices. Now that they are ubiquitous, the term seems antiquated and we have shifted to using “probeware” instead.
Probeware is educationally important for many reasons. Its use of computers accurately reflects how most modern science is done. Compared to hand data collection, it is faster, allowing students to undertake more experiments at a faster rate. Most importantly, it provides fast feedback and it helps build strong associations between phenomena and their abstract representation. A student who warms a temperature sensor with her finger and sees the graph of temperature against time immediately understands the graph. Any student using a motion detector who sees time graphs of velocity and distance, immediately understands how these are related.
Why Do It Yourself Probeware?
The ITSI Do-It-Yourself Probe Kit provides the electronics and tools you need to build and test circuits that can measure a wide range of properties and get these into to computer.
Probes can be expensive. A comprehensive collection for one lab station starts at $1,000 or more. If your school can afford this, by all means buy them from one of the wonderful, dedicated companies that supply probeware.[1] As we were planning the ITSI project, we wanted to supply every participant with a classroom set of probeware, but that was completely impossible. Instead, we chose to assemble an inexpensive probe kit that includes all the parts needed for 14 different probes that can be used in scores of experiments.
We advocate working kit construction into the labs associated with science courses. There are two advantages to this, in addition to the cost savings: students will learn some valuable electronics and they improve their experimental skills.
The kit gives a taste of electronics, physics, and computer interfacing. The electronics is not hard and provides a nice introduction to the hardware side of information technology. This is important for students, because few in IT have even the slightest understanding of electronics, and those that do are uniquely prepared for a range of rewarding positions. The electronics that is used is also a great introduction to electrical engineering and applied science. Every sensor is based on some basic scientific principle at the atomic level and these same principles are at the heart of many chemical and biological phenomena.
The national standards and many of the state standards call for extended student investigations. Students often come up with wonderful ideas for investigations that cannot be done for lack of instrumentation. The project may require data acquired very quickly or slowly over weeks; the effect might be difficult to measure, such as the body temperature of a cockroach or the force exerted by a gecko foot; or the experiment might require measuring a quantity such as pressure that does not match available equipment and budgets. Students who are able to create their own instruments using the ideas in this guide, can undertake a much larger range of original investigations.
About This Guide
 Even though this guide requires only a
limited number of electronics parts, it provides a solid introduction to electronics,
sensors, and some important experiments that can be done with them.
Even though this guide requires only a
limited number of electronics parts, it provides a solid introduction to electronics,
sensors, and some important experiments that can be done with them.
Do not be overwhelmed by all the information we have included. This guide is a reference, not a text. Feel free to skip around and use just the parts you need at any one time. We wanted to make it a reference that teachers and students can return to over and over.
This guide is developed for teachers. Students would not be expected to work through the guide. Instead, you should decide what probe-based experiments you want to offer and then work backward to determine exactly how much of the content of this guide is needed for your students. ITSI workshop participants are welcomed to excerpt from this guide to create appropriate student materials. We fully support this use of the guide, as long as you give us credit and don’t sell your excerpt. We encourage you to post your student materials on the ITSI website so other teachers can use them as well.
We have purposely minimized the parts that this guide needs to keep the price of the components down. By searching the Internet for leftovers and ordering 650 items at once, we were able to keep the total cost of each kit to $25, exclusive of the two Vernier parts. Some of these parts are a bit sub-standard, but even these provide an opportunity for learning. Students should never trust their equipment and should develop a skeptic’s approach that includes always double-checking everything.
Summary of the Sections
This guide starts with some important safety information in Section 1. Although the approach we have developed minimizes hazards, every teacher and student should be aware of potential dangers and get in the habit of being careful.
The bulk of the guide should be seen as a series of notes and applications that can be approached in any order, depending on the knowledge of the reader. For students with no understanding of electricity, Section 2: “Basics” is designed to help sort out current, voltage, resistance, and some basic concepts that will be used over and over. Even someone familiar with these terms will find useful information in the “Matching Outputs and Inputs” part.
Section three lists the parts in the ITSI kit with pictures. The ITSI kit includes a very useful digital multimeter (DMM). The fourth section discusses how to use this meter and how to fix it if something goes wrong.
In Section five, you make your first probe, a temperature sensor that can be used in many different experiments. This requires the minimum of electronics—simply connecting three wires from the sensor to the computer interface. The hardest part of this project is figuring out how to put the sensor on a wand of some sort to make a probe that can be used conveniently.
Actually, there are a number of sensors like the temperature sensor that require connecting only three wires. This type of sensor is addressed in the following two sections. The magnetic field probe and the “rotation sensor” are examples that are included in the ITSI kit. Pressure, humidity, and acceleration sensors are also described that are not in the kit because of cost, but are covered because they might be useful in student projects. The electronics for the three-wire sensors are covered in Section five and experiments that use them are in Section six.
In Section seven, we cover the simplest possible c ircuit that requires more than direct
connections between the sensor and interface. This is the so-called “half
bridge” circuit that needs just a resistor in addition to the sensor. The light
detector and conductive foam force sensor use this circuit as well as the skin
conductivity experiment.
ircuit that requires more than direct
connections between the sensor and interface. This is the so-called “half
bridge” circuit that needs just a resistor in addition to the sensor. The light
detector and conductive foam force sensor use this circuit as well as the skin
conductivity experiment.
There are many situations in which the electrical signals are too small for the interface to detect. This happens for some sensors or when greater sensitivity is needed. For instance, the ITSI kit includes thermocouple wire that can be used to sense small temperature differences, but only generates a twentieth of a millivolt for each degree difference. A voltage amplifier is needed to multiply this signal by 1,000 before the interface can detect it. Section eight shows how a simple but powerful amplifier can be built for the thermocouple and magnetic field sensor. It also contains a circuit for amplifying small currents, such as those generated by a LED when used to detect current.
 Data
from probes enters the computer as raw data represented as binary numbers from
zero to 4,095. These numbers are related to the temperature, magnetic field, or
other physical quantity detected by the sensor. The process that establishes
the exact mathematical relationship between the physical quantity and the raw
data is called calibration and is covered in Section 9.
Data
from probes enters the computer as raw data represented as binary numbers from
zero to 4,095. These numbers are related to the temperature, magnetic field, or
other physical quantity detected by the sensor. The process that establishes
the exact mathematical relationship between the physical quantity and the raw
data is called calibration and is covered in Section 9.
Electrical noise originates as unwanted signals that get mixed into the signal generated by a sensor. Some sensors, like the motor used in Second 11 are inherently noisy. Noise also often limits how much amplification is possible, because the amplifier not only amplifies noise, but can contribute noise as well. Even a resistor generates noise due to the random thermal motion of its parts. Section 10 shows how to reduce noise by keeping it out in the first place and filtering it once it gets in.
Section 11 describes some clever sensor tricks that use some common devices that are not normally considered as sensors. The section shows how DC motor can measure distance, a magnetic field sensor can measure force, and a thermocouple can measure humidity.
Every one of the sensors employs some basic physical principle. Section 12 briefly describes how a broad range of sensors “work,” including all those in the kit. An entire science course could be built around this fascinating topic.
Credits
This guide is based upon work supported by the National Science Foundation under Grant No ESI-0624718. Any opinions, findings, and conclusions or recommendations expressed in this material are those of the author(s) and do not necessarily reflect the views of the National Science Foundation.
 The author of this guide is Robert Tinker, the principal investigator
for the ITSI project. Ed Hazzard contributed throughout to the pictures,
construction ideas, data, and hot glue technology. Cynthia McIntyre reviewed
and edited the guide. Trudi Lord scoured the Internet for the best possible
collection of materials for the kit. Stephen Bannasch, Scott Cytaki, Aaron
Unger, and Sam Fentress have created the fabulous software system used by ITSI.
Carolyn Staudt, the project director, kept the entire team on target and under
budget. Greg Collison (pictured at left) volunteered time to help us sort and
pack the kits. Teachers and professional development experts have contributed
many helpful suggestions and critiques. Thanks to all of you.
The author of this guide is Robert Tinker, the principal investigator
for the ITSI project. Ed Hazzard contributed throughout to the pictures,
construction ideas, data, and hot glue technology. Cynthia McIntyre reviewed
and edited the guide. Trudi Lord scoured the Internet for the best possible
collection of materials for the kit. Stephen Bannasch, Scott Cytaki, Aaron
Unger, and Sam Fentress have created the fabulous software system used by ITSI.
Carolyn Staudt, the project director, kept the entire team on target and under
budget. Greg Collison (pictured at left) volunteered time to help us sort and
pack the kits. Teachers and professional development experts have contributed
many helpful suggestions and critiques. Thanks to all of you.
 Section 1: Safety
Here are some rules that will keep you and your circuits safe.
1. Wear goggles with side protection. We don’t want wires accidentally getting in anyone’s eye.
2. Always disconnect from the computer before working on the Experiment board. This removes any chance of hurting the computer, the chips, or you.
 3.
Do not touch any part of the circuit when
you are testing the circuit and it is connected to the computer.
3.
Do not touch any part of the circuit when
you are testing the circuit and it is connected to the computer.
4. Do not touch other fixed metal objects (like plumbing, a computer, or a metal chair) or any water, when your circuit is connected to the computer.
 5.
Do not use your fingers to remove chips.
Many people have ended up with the chip embedded in their fingers. Use a small
screwdriver instead, and gently pry the circuit loose from both ends. Actually,
it is best to simply leave the chips in the Experiment board all the time.
There is lots of room for them.
5.
Do not use your fingers to remove chips.
Many people have ended up with the chip embedded in their fingers. Use a small
screwdriver instead, and gently pry the circuit loose from both ends. Actually,
it is best to simply leave the chips in the Experiment board all the time.
There is lots of room for them.
6. Before connecting a new circuit to the computer, have someone else check that it is correct. An incorrect circuit is no danger to you, but it could ruin kit parts.
7. Make neat circuits. A neat circuit is easier to check, to understand, and to modify. A rat’s nest circuit with lots of bare wires can cause errors. Two wires that are not supposed to touch can touch and burn out the interface circuit. Keep the leads short and insulate them with insulation that you have stripped off other wires, or use the heat shrink tubing.
8. Keep your work area neat. Keep unused materials stored away. A mess can lead to unexpected mistakes.
9. Until you are familiar with the DMM, never set it to
read current. Don’t even rotate the switch
past the current settings. It is easy to pass too much current through the DMM
when it is set for current and this will burn out a fuse that protects the DMM
but is a giant pain to replace. If your DMM suddenly seems to fail, it is
probably because this fuse is burned out. The most common way to blow the fuse
is to connect the leads to two ends of a battery or some voltage source as you
would to measure voltage, but then switch to current. A very large current can
flow—too much for your DMM. That’s why there is a fuse.
Know the Dangers and Non-Dangers
There is no way to be hurt by the low voltages in these circuits. The power used in our experiments is +5 volts derived from the computer. This is not an electrical danger, nor is there any danger from a properly working computer.
If the Experiment board is disconnected from the computer, it poses no electrical danger. This is why it should be disconnected unless in use. Disconnection also removes power from the Experiment board, so an incomplete or incorrect circuit cannot cause harm to the chips. Connect to the computer only when a circuit has been completed and carefully examined by someone else for errors.
The greatest electrical danger comes from a fault inside the computer that results in one side of the 120 V AC power main being connected to some part of the computer. A computer can still work in this condition but is a danger if the user touches a ground while touching the computer. A ground can be supplied by plumbing, metal on another computer or appliance, or water on the floor or sink. This applies as well to anyone using the computer or the Experiment board. So, in the unlikely chance that a computer has this kind of internal fault, never use the Experiment board while also touching a ground.
There is a danger to the chips, the temperature sensor, and the magnetic field sensor from static electricity. This is a major problem in the winter when the air is dry. Store the chips and sensors in conductive foam or a conductive plastic container (these are pink or metallic-looking). Before touching one, hold onto a ground with the other hand. Handle them as little as possible. Never put them in a pocket or other clothing unless they are inserted in conductive foam or conductive plastic. Do not confuse conductive plastic with regular plastic, which carries static charge and can zap a delicate circuit in a microsecond.
Section 2: Basics
This section covers basic electrical concepts. If you are stymied by electronics because you lack a clear understanding of the difference between voltage and current, or because you are not sure what a resistor does, this section is for you.
This section is designed to help sort out current, voltage, resistance, and some basic concepts that will be used over and over. If you are just a beginner, you may want to skip the last two topics. If you are familiar with the basics, you might find useful information in these parts.
Charge
Electronics is all about controlling and detecting the movement of charges. The most prevalent charged object in electronics is the electron. Electrons are tiny, 1/2000 the mass of hydrogen, the lightest element. Each electron carries one unit of negative charge, called the elementary charge. Because it is charged, an electron tries to get away from anything charged negatively and is attracted by anything charged positively. Since the nucleus of every atom contains positive protons, electrons are strongly attracted to them, forming electron shells.
In metals, each atom contributes one electron that is free to roam throughout the metal, much like gas molecules are free to roam around a room. Because electrons are so light, they move easily and quickly in response to external electrical fields. This is why metals conduct electricity. The atoms in insulators, on the other hand, hold on to their electrons and don’t let them roam, so charge cannot flow through them.
If you could collect 6.24x10¹⁸ electrons in one place, you would have a coulomb (C) of charge, the standard measure of charge. There are about 1,500 C of free electrons in a gram of copper, so one coulomb does not sound like much. But you will never find even the slightest fraction of a coulomb in one place without some balancing charges. The attractive force of one positive coulomb and one negative one separated by a meter would be almost equal to the weight of a million metric tons!
The symbol Q is traditionally used to stand for the amount of charge something has in coulombs, and the symbols q or e are often used stand for the elementary charge, which is 1.6 x 10⁻¹⁹ C.
Sometimes, there is a slight charge imbalance. If you rub two different insulators, a tiny bit of charge can be transferred from one to the other. “Static cling” is an example of this. Other examples include the shock you get after walking across a rug in the winter, or lightning caused by water drops falling through air. All these effects are due to miniscule fractions of a coulomb.
Electrons can flow through a wire, because their negative
charges are exactly balanced by the positive charges on the copper atoms that
donated the electrons in the first place.
As a result, the wire is everywhere neutral. If, by some chance, electrons
happen to bunch up in one place, they will upset the charge balance, making
that part slightly negative, which will send the extra electrons fleeing until
perfect neutrality results.
The extreme force caused by any charge imbalance explains why charges only flow in complete circuits. If you pull a coulomb of electrons out of one end of a wire, you must arrange for a coulomb to flow in the other end to keep the charge balance. If none can flow in the far end, you cannot pull the electrons out the near end and no charge will flow.
Electrons in metals are not the only source of charge in electronic circuits. Ions are atoms that are not neutral, having either too many or too few electrons in their electronic shells. In a liquid, ions can drift in response to electric fields, just like electrons do in a wire. This is why salt in water will conduct electricity. Ions are much bigger that electrons and in solution they are surrounded by a snowball of frozen water, so they move much more slowly than electrons. Ions can be made from a gas, too, and they also carry charge. This is what happens in a fluorescent light. In semiconductors electrons are lightly bound to atoms so they are insulators, but light, temperature, or impurities can jog the atoms enough to create in a few roaming electrons, making them conductors. This is why substances made from these atoms are called semiconductors. Sometimes the hole left by a roaming electron can move around, too, acting like a positive charge.
Current
Electrical current is the flow of charge. Imagine you wanted to find out how much current was flowing in a wire. You could cut the wire and insert a tollbooth where you would count the number of electrons that zoomed by. If you counted the number of electrons in a second you would be measuring the current. Current is measured in amperes (A). One ampere is a coulomb of charge flowing every second. The symbol usually used for current is I.
An ampere (or amp for short) is a large current, so milliampere (mA) is often used in electronics, for 1/1000 of an ampere. In some experiments, we will actually deal with a microampere (µA), which is a millionth of an amp, and a nanoampere (nA), which is one-billionth of an amp.
Benjamin Franklin did a lot of experiments with electricity and made a guess that current was actually something with a positive charge flowing from plus to minus. Since his time, that has been the definition of current—the flow from positive to negative.
Now we know a lot more and realize that current is usually negative electrons flowing from minus to positive. This creates a lot of confusion, because Franklin got it backwards. So, we cling to the idea that current flows from positive to negative. This is sometimes called conventional current to distinguish it from the actual electron flow, which goes from negative to positive. Thanks a lot, Ben.
Voltage
Voltage is a kind of electrical pressure that can cause charge to flow. A positive charge such as a positive ion will flow from a higher voltage to a lower voltage. A negative charge such as an electron, with flow the other way, from a lower voltage to a higher one. The conventional symbol for voltage is V. Voltage is measured in volts.
At the atomic level, a negative voltage can be produced by increasing the concentration of electrons, squeezing them together slightly. A positive voltage is the opposite; it can be made by removing a few electrons, making them slightly less dense. If one end of a wire is positive and the other negative, electrons will move from the negative end where there is more of them, to the positive end where there are fewer. This flow constitutes a current. This current will flow until there is no voltage difference.
We don’t normally talk about the density of electrons, because it does not change much. In the discussion under “charge” above, we emphasized how much force is caused by the slightest imbalance of charge. Because of this, the tiniest difference in electron density causes huge forces that push the electrons to neutralize any difference. For example, to raise the voltage of a 20 cm diameter copper sphere to 1,000 volts would only require 10-9 C or about 5 billion electrons. That sounds like a lot, but if the sphere were solid it would contain 4x10²⁰ free electrons so only one extra one for every 400 billion would be required to generate 1,000 volts. Our circuits will be limited to 5 V, so the electron density differences we will encounter are even less.
Voltage and energy are closely linked. It requires energy to push extra electrons into a region to give it a negative voltage. It also requires energy to pull electrons out of a region to make it positive. Thus, a voltage difference represents a potential energy difference. For this reason voltage is sometimes called “potential.” The energy can be turned into other forms by letting the charges flow until there is no voltage difference.
By definition, one joule of energy is released with a coulomb of charge flows through a voltage difference of one volt. Similarly, it requires one joule to force a coulomb of charge to gain one volt of energy.
Voltage is always measured as a difference between two parts of a circuit. It is a measure of the amount of energy that would be released if a coulomb could flow from one point to the other. It makes no sense to assign the voltage of one point in a circuit. A voltage is always measured as a difference between two points, or “relative to” some point.
A similar situation happens with gravitational potential energy. A ball on a table does not have a unique potential energy. Relative to the floor it has a positive potential, but relative to the ceiling it has a negative one.
In circuits a “ground” point is often assigned to part of a circuit and all voltages are measured relative to that point. The ground may or may not be electrically connected to the earth; that is not the point. The ground is really just the reference for voltage measurements, much like you might define the floor of your room as the reference for all gravitational potential energy measurements in your room. So, if there is a ground, people will say things like: “This point is at 2.5 volts.” That is shorthand for saying: “The voltage difference between this point and ground is 2.5 V.”
Resistance
 Resistance
is a measure of how difficult it is for charge to flow. A voltage is always required
to make charge flow, but how fast charge flows through a circuit depends on the
resistance of the circuit. If there is a large resistance, the amount of
current will be small. Conversely, if the resistance is small, the current will
be large.
Resistance
is a measure of how difficult it is for charge to flow. A voltage is always required
to make charge flow, but how fast charge flows through a circuit depends on the
resistance of the circuit. If there is a large resistance, the amount of
current will be small. Conversely, if the resistance is small, the current will
be large.
The usual symbol for resistance is R and its units are ohms (Ω). One ohm is a volt per ampere. The resistance of a part can be measured by applying a voltage V across it and measuring the resulting current I. In symbols,
R = V/I
This equation is known as “Ohm’s Law.” Not all electronic parts obey this equation, so it isn’t much of a law. Suppose you had an unknown electronic component and you repeated the measurement of current for a range of different voltages. If you got the same value for R in each case, your component would be called “ohmic” because it does obey Ohm’s Law. If you tried this with a light bulb, motor, or LED, for instance, you would find that they are not ohmic.
![]() Resistors
are ohmic. They are handy components that are used throughout electronics to
restrict the flow of current. The ITSI kit has resistors with valued from 1 Ω
to 1 MΩ (that’s 106 ohms!). The amazing thing is that they are all
the same physical size, even though their resistance is so different. Inside,
they are made from a mix of clay and carbon in the form of graphite. By
changing the concentration of graphite, these huge differences can be obtained
in the same space.
Resistors
are ohmic. They are handy components that are used throughout electronics to
restrict the flow of current. The ITSI kit has resistors with valued from 1 Ω
to 1 MΩ (that’s 106 ohms!). The amazing thing is that they are all
the same physical size, even though their resistance is so different. Inside,
they are made from a mix of clay and carbon in the form of graphite. By
changing the concentration of graphite, these huge differences can be obtained
in the same space.
The symbol for a resistor is shown at
right.
Resistors have color bands that
indicate their value. For information about reading these bands, see http://en.wikipedia.org/wiki/Resistor.
There are several toosl on the web that convert the colors to values, such as http://www.dannyg.com/examples/res2/resistor.htm.
 Capacitance
Capacitors store charge. They consist of two conductive surfaces separated by an insulator. The symbol for a capacitor reflects this structure. It is shown at right.
Charge flows into a capacitor on one lead to one surface. This induces the opposite charge on the other surface, which can happen only if charge flows OUT the other lead. So, from the outside, it looks like charge flows through the capacitor, even though there is no connection between the leads. Because there is no connection, the flow cannot continue indefinitely. As more and more charge flows in one side, the charge density goes up, causing a voltage that opposes more flow. So, if you attach a capacitor to a voltage source, some amount of charge will flow in and then it will stop flowing. The ratio of the charge Q that will flow into a capacitor to the voltage V that causes the flow is the capacitance C. As an equation:
C = Q/V
 The units of capacitance are farads (F). A
capacitor that can store one coulomb when one volt is applied would have one
farad of capacitance.
The units of capacitance are farads (F). A
capacitor that can store one coulomb when one volt is applied would have one
farad of capacitance.
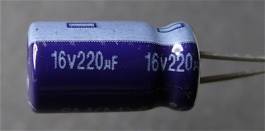
The capacitor at right has a capacitance of 220 µF, or 2.2x10⁻⁴ F, which is relatively large. Useful capacitors can be as small as a few picofarads; the largest ones can be 1 F, but that is unusual.
The 16 V printed on this capacitor indicates that no more than 16 V can be applied to it, or it will fail.
A capacitor that has a plus and minus side is “polarized.” The capacitor pictured is polarized. The rectangle on the top is supposed to be a minus sign to indicate which lead is minus. The nearest lead must be always kept more negative than the other lead or the capacitor will fail. The plus lead is longer than the minus one, too. Some capacitors have a plus sign instead and the minus.
There are several kinds of capacitors. Some are polarized
like this one, whereas others are not. ![]() If
a capacitor is polarized, its symbol includes a plus sign on the side that must
be positive. Symbols for polarized capacitors are shown at right. The left-hand
one is better because the other can easily be confused with a battery.
If
a capacitor is polarized, its symbol includes a plus sign on the side that must
be positive. Symbols for polarized capacitors are shown at right. The left-hand
one is better because the other can easily be confused with a battery.
Inductance
[There are no inductors included in the ITSI kit. This page will be supplied later for completeness. ]
Equivalent Resistance
The idea of “equivalent resistance” is that a component or group of components act as though they are created from other components. The concept is quite helpful in analyzing and simplifying circuits.
The simplest equivalence is that of two resistors in a row are equivalent to
one that is the sum of the two:
![]() A
battery is a source of voltage. Most common batteries generate about 1.5 V, but
there are many other voltages possible. A battery is represented by two
parallel lines, one of which is longer, representing the positive terminal.
This same symbol is used to represent a voltage source that is equivalent to a
voltage, but may be something else.
A
battery is a source of voltage. Most common batteries generate about 1.5 V, but
there are many other voltages possible. A battery is represented by two
parallel lines, one of which is longer, representing the positive terminal.
This same symbol is used to represent a voltage source that is equivalent to a
voltage, but may be something else.
 No
battery can supply a very large current at its rated voltage. The voltage will
drop if it is called on to supply a sufficiently large current. This is often
represented as the equivalent circuit to the right. The symbol on the left is
represents a perfect voltage source that can supply an infinite current at
voltage V. The resistor R is not really part of the voltage source, but it
accounts for the fact that it is not perfect. The output voltage of this real
source Vout when it is supplying a current I, is V minus IR. In
other words, the actual voltage produced by this real battery is reduced by the
IR voltage drop through the equivalent resistance R. It will output the ideal
voltage V only when it not asked to provide any current! R is sometimes call
the output resistance. The bigger and fresher the battery, the smaller R will
be.
No
battery can supply a very large current at its rated voltage. The voltage will
drop if it is called on to supply a sufficiently large current. This is often
represented as the equivalent circuit to the right. The symbol on the left is
represents a perfect voltage source that can supply an infinite current at
voltage V. The resistor R is not really part of the voltage source, but it
accounts for the fact that it is not perfect. The output voltage of this real
source Vout when it is supplying a current I, is V minus IR. In
other words, the actual voltage produced by this real battery is reduced by the
IR voltage drop through the equivalent resistance R. It will output the ideal
voltage V only when it not asked to provide any current! R is sometimes call
the output resistance. The bigger and fresher the battery, the smaller R will
be.
 A
voltage meter measures the voltage between two points. It is symbolized as a
circle with a “V” in it. This is also the symbol for an ideal voltage sensor,
one that senses a voltage difference without drawing any current. It is
impossible to create an ideal voltage sensor; they always require a bit of
current. A real voltage sensor has the equivalent circuit shown at right. There
may not really be a resistor connected across its terminals as shown, but it
acts as though there is one. When this real meter is connected to a voltage
difference V, it will draw a little current, equal to V/R.
A
voltage meter measures the voltage between two points. It is symbolized as a
circle with a “V” in it. This is also the symbol for an ideal voltage sensor,
one that senses a voltage difference without drawing any current. It is
impossible to create an ideal voltage sensor; they always require a bit of
current. A real voltage sensor has the equivalent circuit shown at right. There
may not really be a resistor connected across its terminals as shown, but it
acts as though there is one. When this real meter is connected to a voltage
difference V, it will draw a little current, equal to V/R.
The equivalent resistance R is called
the input resistance. For a very good voltage detector such as the digital
meter, the input is quite high,
100 MΩ or more, so not much current is required.
Matching Outputs and Inputs
 Suppose
you want to measure an unknown voltage. You attach a voltage sensor to the
unknown source as shown at right. Naturally, if your voltage sensor is accurate,
you expect your sensor to record V, the voltage of the voltage source. But you
don’t, the voltage measured will always be less.
Suppose
you want to measure an unknown voltage. You attach a voltage sensor to the
unknown source as shown at right. Naturally, if your voltage sensor is accurate,
you expect your sensor to record V, the voltage of the voltage source. But you
don’t, the voltage measured will always be less.
In real circuits, there is always some error. The voltage you read in the meter, Vm, will be less than V. Sometimes the error is negligible, sometimes not. When you use circuits, you always need to be aware of this possible source of error.
 The
error occurs because there are no such things as ideal voltage sources and
detectors. The equivalent circuit of real components would be the following. Rv
is the equivalent output resistance of the voltage source and Rm is the
equivalent input resistance of the voltage detector. As you can see, the
current drawn by the detector causes a voltage drop across Rv so the voltage
sensor is in error by that voltage drop. If Rv and Rm are the same, the meter
will only read one-half the actual value of the voltage source.
The
error occurs because there are no such things as ideal voltage sources and
detectors. The equivalent circuit of real components would be the following. Rv
is the equivalent output resistance of the voltage source and Rm is the
equivalent input resistance of the voltage detector. As you can see, the
current drawn by the detector causes a voltage drop across Rv so the voltage
sensor is in error by that voltage drop. If Rv and Rm are the same, the meter
will only read one-half the actual value of the voltage source.
This problem can be ignored if Rm is much larger than Rv. If Rm is a thousand times Rv, then the error will only be 0.1%. When
All the circuits in this guide have been designed to have low output resistances and high input resistances, so this will not be a problem. However, if you create a circuit that does appears to be losing voltage, check the input and output resistances.
Section 3: The Kit
Parts
The Parts in the Kit
Big:
· Digital Multimeter. (DMM) Your electronic eyes and ears. If everything works, you probably don’t need it, but when things don’t work, this helps you track down problems.
· Go-Link USB interface (Vernier). This converts voltages into signals that the computer can read through any USB port.
· Header with cable. This connector simplifies making solderless connections to the GoLink.
· Experiment board. This provides a place to build circuits without solder.
· DC motor
· Microphone
Small:
· I-amp (Instrumentation amplifier) AVOID STATIC* This is used in a few circuits to amplify small signals.
· Op-amp (Operational amplifier) AVOID STATIC* This is another form of amplifier that can do many different operations. We will use it to convert small currents into a useful signal.
· Temperature Sensor (IC – integrated circuit) AVOID STATIC*
· Phototransistor. Used for detecting light.
· LED (Light Emitting Diode) – Red.
· LED – Green
· Magnetic field sensor (Hall Effect probe) AVOID STATIC*
· Magnet
· Variable resistor 100 kΩ (potentiometer or pot)
· Assorted Mylar capacitors
· Assorted electrolytic capacitors.
· Assorted resistors
|
Ohms |
# per kit |
Use |
|
100 or 120 |
1 |
Program the iAmp
gain for 1,000x |
|
220 or 390 |
1 |
Current limit LEDs
and program iAmp gain |
|
1K or 1.2K |
2 |
Generate 2.5 V
using a half-bridge |
|
10K |
2 |
Program the iAmp
gain for 10x |
|
100K |
1 |
Use in GSR or
op-Amp for 50microA full scale |
|
1M |
1 |
In op-Amp for 500
nA full scale |
Miscellaneous
· Thermocouple wire (iron and constantan = type J). Used for measuring small temperature differences.
· Heat shrink tubing (wire insulation)
· Clip leads
· Solid wire, 4 colors
· Black high density anti-static foam. Holds the sensitive components and keeps them from static discharge. The foam is also used to make a force sensor.
· Ziplock bags
· Wire cutters
· Mini screwdriver
*The i-amp, op-amp, temperature sensor, and magnetic field sensor all have an incredible amount of sensitive internal circuitry. These circuits can be ruined by static electricity. Keep these parts inserted in conductive (black) foam and handle them as little as possible. Be particularly careful in dry climates and seasons.
Mug Shots
You should learn the names of the parts in the ITSI kit that we will use. They are shown in the following pages.
The Vernier interface, header, and experiment board
The Sensors (one of each is supplied)
Sound Sensor. The kit includes a microphone on a plastic rod.
Temperature Difference Sensor. The kit contains two strands of very thin wire for making thermocouples that can measure temperature differences. One wire is made of iron and the other of Constantan, a copper-nickel alloy. To find the iron strand rub the wire on white paper, you will probably see a red-brown stain from rust.
 Electronic
Parts
Electronic
Parts
Section 4: Using the
DMM
 This section describes how to use the digital
multimeter (DMM). The DMM was included in the kit to help track down problems,
so it is a good idea to learn how to use it.
This section describes how to use the digital
multimeter (DMM). The DMM was included in the kit to help track down problems,
so it is a good idea to learn how to use it.
The DMM gets its name because it can be many different meters. It can measure voltage, current, resistance, and much more.
Plug it in and Turn it On
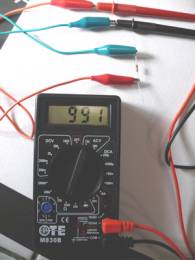
The photograph at right shows a DMM in its off position. The large central dial selects the electrical property to measure (e.g. voltage, resistance) as well as the range of values.
You will notice that there are three places to plug in the two leads. For the ITSI experiments always use the two shown.
- Plug the black lead in the “common” socket, marked with “COM.” This provides the reference for voltage measurements and the return path for current.
- Plug the red lead into socket labeled V/Ω/mA. This is used for most voltage, resistance, and current measurements, at least when the current is in the milliamp range.
The big central knob points to “OFF” in this illustration. Always turn the meter off when you are not using it. The DMM runs off a battery and the battery has a limited life. It is easy to mistake the correct end of this dial. Can you tell from the photograph whether it is point to “OFF” or to “200Ω”? If you look very carefully, you can see a slight indent on the end next to “OFF.” Always look at that end to figure how it is set.
When you start using the DMM, use only the settings on the left side of the dial. The right-hand side is for alternating voltage, which you will not encounter, and current, which must be done carefully, and some other specialized measurements.
Look at the settings on the left. You will see five settings bracketed with “DCV” and five others near the “Ω” symbol. The top five all measure voltages and the bottom five measure resistance. (The “DC” refers to “Direct Current” and simply means that in this setting, the meter will record the average value of the voltage. If the voltage varies, the variation will be ignored. If you care about how much it alternates, use the “ACV” setting.) The numbers indicate the largest value of voltage or resistance that can be measured for that setting.
Measuring Voltage
The following describes the five voltage ranges counterclockwise (CCW) from the OFF position:
1000 DVC. This can be used to
measure steady voltages up to 1,000 V. You should never have any use for that!!
200 DCV. Here the maximum is 200
V. The meter has four digits, so if you measure 5.0 V with this setting, you
will see 50, which indicates 5.0 V, accurate to a tenth of a volt. This is an
acceptable but inaccurate way to measure five volts. Use the next setting
instead.
20 DCV. Here the maximum value
read is 20 V. This is a good setting for general use in a circuit where you
expect nothing larger than 5 V. It allows you to measure with an accuracy of
0.01 V.
2000m DCV. This scale has a
maximum of 2000 mV, which is the same as 2 V. In ITSI circuits, which can have
5 V differences, some measurements will be off-scale. Using this setting has
the advantage of accuracy to 0.001 V or 1 mV.
200m DCV. This is the most
sensitive voltage scale. It can sense a change of 0.1 mV or 100 µV. This
setting is, however, limited to voltages of 0.2 V or less.
 To measure voltage, simply touch the sharp
ends of the leads to two places in a circuit. The meter will show the voltage
difference between those two points. If it is a positive number, the red lead
will be touching the more positive point in the circuit. The meter can also
display a negative number, indicating that the red lead is touching a more
negative voltage.
To measure voltage, simply touch the sharp
ends of the leads to two places in a circuit. The meter will show the voltage
difference between those two points. If it is a positive number, the red lead
will be touching the more positive point in the circuit. The meter can also
display a negative number, indicating that the red lead is touching a more
negative voltage.
Try measuring the voltage provided by the GoLink. Plug the header into the GoLink and the GoLink into a computer. Then measure the difference between the GND and +5 terminals on the header. Try selecting different ranges. What do you record? What range is best? Check your measurements against another meter if you can.
Measure Resistance
Now, continue rotating CCW into the resistance ranges. There are five ranges from a maximum of 2000 kΩ (which is 2 MΩ) to 200 Ω. The photograph at right shows the meter being used to measure the resistance of a resistor. The dial is set to the 2000 Ω scale, and it reads 991 Ω. This is well within tolerance for a resistor that is supposed to be within 5% 1 kΩ.
It is hard to connect the meter directly to a tiny resistor. Instead, clip leads were used in the picture. Note how clip leads have been attached to the meter leads and these are used to connect to the resistor.
Note: it is impossible to measure the resistance of anything that is in a circuit. The component needs to be disconnected from the circuit before measuring its resistance.
REMEMBER: Turn the DMM off when not
in use.
Test the Clip Leads
The first thing to do with the DMM is to measure the resistance of the clip leads. They should read zero resistance, but many of them are faulty. First, learn what the DMM reads when there is no resistance. Do this by holding its two leads so they contact each other. What do you see on the various resistance ranges? Now repeat this with each of the leads. Test a lead by connecting it from the red to the black probes. Clearly mark any defective leads so you don’t use them by accident. They can be repaired.
Trouble Shooting the DMM
If you DMM appears to not work properly, you may be able to fix it. If it is completely dead, it may be the battery. The original battery is very low quality and may last only a few hours. There are two Phillips screws in the back of the DMM. Use the small screwdriver to remove these. Remove the battery. Before throwing the battery away, see whether the problem is caused by bad contacts to the battery. Find the two metal strips that are supposed to make contact with the battery. If these are not bent out away from the case a bit, they will not make good contact. Gently bend them and see whether the meter operates correctly. If not, try replacing the battery with a standard 9 V battery.
Don’t Measure Current
Current is the trickiest quantity to measure. To measure the current through a part of a circuit, you have to take the circuit apart and insert the DMM. You also have to be very careful to avoid passing too much current through the DMM, or you will burn out a fuse. This makes the meter useless until you find a replacement fuse.
Our advice: don’t measure current and never set the dial to any of the current settings. Don’t even spin the dial quickly past the current scales.
Section 5: A First
Probe
This section provides an introduction to the idea of making probes with the ITSI kit. You will end up with an accurate temperature sensor that you can use in a wide range of experiments.
The Parts You Need
- A networked computer with a USB port
- The Vernier GoLink interface
- The Vernier Header
- The TMP36 temperature sensor
- Wire
- Wire cutters
Overview
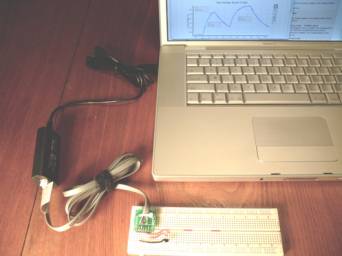
The ITSI approach to experimenting involves interfacing a computer to a sensor
and use software to display the data from the sensor. The following diagram illustrates
the main parts of most ITSI experiments.
Suppose you want to measure some property of the real world. With this kit, you will be able to measure temperature, light, magnetic field, rotation, force and more. For each property, there is some sensor that converts the property into an electrical signal. Most sensors generate a voltage, but some produce current. Sometimes the electrical signal is too small and needs to be amplified, but in the case of most of our sensors, you can do without the amplifier.
The last step in getting a signal into the computer is an interface. We will use the Vernier GoLink. This device accepts a signal that is between zero and five volts, and converts it into a digital form that the computer can read.
Making your own probes only requires building that central part enclosed in the dotted line. Functioning sensors and the GoLink interface are supplied. All you have to do is connect them together. For the simplest sensors, all you have to do is connect three wires to the GoLink. This is all that is required for this first experiment.
The GoLink
It is important to understand the function of the GoLink,
because you will be connecting to it. It does two things: it supplies power and
accepts a voltage input.
The GoLink as a power supply. The GoLink acts like a 5-volt battery. You can use this to power all the circuits you make. This is a great convenience and safety feature. You do not have to use batteries that always run down and you do not have to build a power supply that might require connection to AC power. The 5 V is available on the header at the pin called “5V” that is connected to a yellow wire.
Every battery needs two connections. The low, or minus, side of the ‘battery’ is connected to the “ground” wire, called GND on the header connected to a black wire. Ground is a common term for the reference, or zero, voltage. It may or may not actually be connected to the earth. If it is, it will be through the computer, because the GoLink shares its ground with the computer through the USB connector, as indicated.

The GoLink voltage input. That circle
with a “V” in it is the symbol for a voltmeter. Like a voltmeter, the GoLink
senses the voltage. A voltmeter converts the voltage into a number of needle
motion that humans can read. The GoLink reads the voltage applied to the “SIG1”
pin on the header connected to a blue wire. This is converted into a string of
0’s and 1’s that a computer can read through a USB port. It reads the voltage
200 times a second and sends a number for each reading.
Voltages are always the difference between two points. As you can see from the diagram, the voltage is measured between the SIG1 input and GND. In other words, the voltage is measured relative to ground.
Don’t make the input range too large. The GoLink voltage input range is limited. It cannot sense a voltage outside the 0-5 V range. The GoLink divides the 0-5 V range into 4096 equal steps and assigns a unique 12-bit binary number to each. Zero volts is represented by 0000 0000 0000 and 5 V is represented by 4,095 (in binary that is 1111 1111 1111.) These numbers are the “raw data” that the computer reads. The computer transforms these raw data numbers into force, or distance, magnetic field, or whatever, using calibration information that it has stored.
Don’t make the input range too small. The individual voltage steps corresponding to a change of one bit in the raw data are about 12 mV. Thus, if the input voltage changes less than this amount, it will not cause any change in the GoLink output. In fact, you want the input range to be much larger than 12 mV so that many different raw data numbers are generated. Ideally, you want the input to go all the way from 0 to 5 V so that the GoLink will generate 4096 unique values. For many situations, however, 1 V range or less is adequate. Suppose, for instance, your input voltage ranged from 3.0 V to 3.5 V. This would correspond to about 1/10 the total range, so the GoLink would generate raw data that spanned about 410 steps. This means that 410 different values would be stored in the computer. This is adequate resolution. A graph with 410 different vertical values looks very smooth.
 The TMP36 Sensor
The Analog Devices TMP36 sensor is a tiny device that looks like a transistor but actually contains sophisticated electronics consisting of many transistors. Fortunately, you do not have to learn how it works, just what it does.
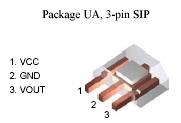
As you can see from the photograph at right, there is a flat side on the device. If you look very carefully, you will see “TMP36” marked on it, along with the Analog Devices’ logo and some other letters and numbers.
When you hold the sensor as shown in the photograph, with the flat side toward you and the three pins pointing down, the pins are numbered 1-3 from the left.
Like all circuits, it needs some electrical power. This is supplied by attaching pin 3 to ground and pin 1 to +5 V. When power is supplied, pin 2 will generate an output voltage that is proportional to the temperature of the sensor. At 25°C, pin 2 will be at 750 mV. For each degree above 25°C the voltage will increase by 10 mV. For example, at 37°C, normal body temperature, is 12°C above 25°C, so the sensor will generate (750 + 12*10) = 870 mV.
To get a temperature signal into your computer, all you have to do is give power to the TMP36 and connect its output to the GoLink.
This version of the TMP36 (G) is usually accurate to 1°C at 25°C and is guaranteed to be within 2°C. It operates between –40°C and 125°C. Over the entire range, it is usually accurate to 2°C and is guaranteed to be within 4°C. [2] To get more accurate measurements, it should be calibrated.
The Experiment Board
The Experiment board is where you will build circuits that connect sensors to
the GoLink. The board simplifies making circuits because you don’t have to
solder wires together. Instead, you just slide wires into the square holes and
the connections are made inside. The header provides a simple way of connecting
the GoLink to the experiment board. The GoLink plugs into any USB port on any
computer. It delivers the digital signal from its input voltage to the
computer. It also draws some power from the computer for itself, and the
circuits that you build on the experiment board.
The Experiment board has internal connectors that you have to understand. In the main part of the board, the groups of five holes are interconnected vertically as shown in the illustration. Each set of five holes serves as a convenient “tie point” where two or more wires can be connected together simply by pushing them into the holes. There is no connection between each group of five and any other group of five; they are all independent.
Each horizontal row of holes along
the top and bottom are connected all the way from the left to the right ends of
the board. Each of the four rows is sometimes called a “bus.” There are four
independent buses. Each row has 50 holes that are interconnected. These are
handy for connecting to +5 V and ground, since these values are frequently used
in complex circuits. For the simpliest circuits, there is no real need for the
busses.
The Complete Circuit
Several of the sensors can be directly connected to the header. The TMP36 temperature sensor is one of these. The circuit is simplicity itself.
Just three wires are needed to connect three pins on the temperature sensor to three pins on the header.
The hardest part is locating the right pins. Hold the sensor by its leg with the flat part facing you. Pin 1 is on the left, 2 in the center, 3 on the right.
Before beginning, disconnect the header from the GoLink. Place the header and sensor on the Experiment board as shown.
 You
will need three wires with insulation removed from about 1/4 inch at each end.
Cut the wires to the right length and then carefully remove the insulation.
Most of the wire cutters supplied with the ITSI kit are not properly designed
for this (they were cheap—sorry.) They have a notch for stripping wire, but
only from much larger wires. If you are very careful, you can use the cutting
part of the tool to cut the insulation. Be careful to not nick the copper inside.
Or you can use a knife to cut the insulation. Once cut, you can slide it off.
Save the insulation, you can slide it onto other wires and pins.
You
will need three wires with insulation removed from about 1/4 inch at each end.
Cut the wires to the right length and then carefully remove the insulation.
Most of the wire cutters supplied with the ITSI kit are not properly designed
for this (they were cheap—sorry.) They have a notch for stripping wire, but
only from much larger wires. If you are very careful, you can use the cutting
part of the tool to cut the insulation. Be careful to not nick the copper inside.
Or you can use a knife to cut the insulation. Once cut, you can slide it off.
Save the insulation, you can slide it onto other wires and pins.
Then make the following connections
- Connect pin 1 on the TMP36 to +5 V on the header. This is the second from the bottom on the header if you hold it so you can read the lettering.
- Connect pin 2 on the TMP36 to SIG1 on the header. This is the bottom connector on the header
- Connect pin 3 to GND (ground) on the header. This is the second connector from the top.
The resulting connections should look like the right-hand photograph above. Note that the flat side of the sensor is facing to the right in this picture.
Check your connections. When you are sure that you have it right, plug the header into the GoLink and the GoLink into a USB port on your computer. Then run one of the ITSI activities that report raw voltage or use a temperature sensor.
At this point, you should be able to graph the voltage generated by the TMP36
sensor. It should be about 0.75 V and it should go up tens of mV if you warm
the sensor by, for instance, squeezing it between your fingers. You may need to
adjust the scale of the graph to see the line rise and fall. The photograph on
the next page shows the completed circuit and the resulting graph running on
ITSI software.
The following is the equation that relates the temperature T in Celsius degrees to the voltage V in volts, that is generated by the TMP36:
V = .75 + .01*(T – 25) = .01*V + .5
Inverting this equation gives the temperature for any voltage:
T = 100*V – 50
Calibration software converts the raw data into an actual temperature. This is coming soon, but is not yet built into the ITSI software. When it is, the graph will automatically use this last equation and produce a graph in degrees Celsius.
Creating a Probe
For practical experiments, it is not convenient to have the sensor attached directly to the experiment board. Some sort of extension is needed. It is perfectly safe, for instance, to put the TMP36 in water, but you don’t want to put the entire experiment board into your experiment. The temperature sensor needs to be at the end of a rod or pencil.
One approach is to solder long leads to the TMP36. But soldering is a skill—it must be done quickly with minimum solder, or it will damage the sensor. Another approach is to attach leads with hot glue. Hold the leads in place with needle-nose pliers when you add the hot glue.
Another approach is shown here. Here we have cut up the Experiment board with a hacksaw. We cut it right down one column of holes, leaving seven columns intact. Then we peeled off the buses and cut the remaining section in half. The result shown in the illustration is a small block of seven rows with five holes in each. You could even cut this down to three columns to make it lighter.
 This
block can be used to make a simple connection between the TMP36 and wires to a
header attached to the Experiment board as shown below.
This
block can be used to make a simple connection between the TMP36 and wires to a
header attached to the Experiment board as shown below.
Section 6: Three-Wire
Probes
The TMP36 described in the previous section is an example of a three-wire probe: one that simply requires connections to 1) ground, 2) the 5 V output, and 3) the signal input of the interface. The ITSI kit also had two other three-wire probes that are just as easy to connect a magnetic field sensor and a “rotation sensor.”
 Magnetic Field
The magnetic field sensor is a tiny device called a 21E “linear Hall Effect” sensor that looks like another transistor. If you look very carefully at the sensor, you can see a fancy “A” above “21E” etched on the smaller side. Inside the black plastic, there is a sophisticated electronic circuit, manufactured by a company called Allegro.[3]
This device measures the strength of the magnetic field that is perpendicular to its flat sides. In other words, it measures the component of the field passing from the large flat side, through the circuit, and coming out the front. It will not measure any field going sideways through it or along the direction of its pins.
 Like
the temperature sensor, the pins are numbered from 1 on the left to 3 on the
right, when you hold the sensor upright with the lettering facing you, as shown
above.
Like
the temperature sensor, the pins are numbered from 1 on the left to 3 on the
right, when you hold the sensor upright with the lettering facing you, as shown
above.
The pins are not in the same order as used in the temperature sensor, however. For the 21E, the pins should be connected as follows:
- Connect pin 1 on the 21E to +5 V on the header. This is the second from the bottom on the header if you hold it so you can read the lettering.
- Connect pin 2 on the 21E to GND (ground) on the header. This is the second from the top of the header.
- Connect pin 3 of the 21E to SIG1, the signal input in the header. This is the bottom connector on the header.
Check your connections. When you are sure that you have it right, plug the header into the GoLink and the GoLink into a USB port on your computer. Then run one of the ITSI activities that report raw voltage or that use a magnetic field sensor.
The output should be 2.5 V when there is no magnetic field. This goes up 5 mV for each Gauss passing one direction through the sensor. If the field is reversed, the voltage goes down from 2.5 V by 5 mV per Gauss. In other words, the output is offset by 2.5 V. This is done so that the device can report fields in both directions. The output cannot be greater than the +5 V power supplied, or below ground, so a 2.5 V offset makes it possible to measure positive and negative fields of the same strength.
 Rotation
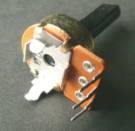
 A
potentiometer, or pot, or variable resistor, is a common device used in many
circuits. Inside the pot, there is a fixed resistor that connects to the outer
two pins. This resistor is made from a thin carbon film that is spread out in a
semi-circle around the central shaft. A wiper is attached to the shaft that
slides across resistor. This wiper is connected to the center pin. The result
is that the resistance between the center pin and either one of the ends can be
changed by rotating the shaft.
A
potentiometer, or pot, or variable resistor, is a common device used in many
circuits. Inside the pot, there is a fixed resistor that connects to the outer
two pins. This resistor is made from a thin carbon film that is spread out in a
semi-circle around the central shaft. A wiper is attached to the shaft that
slides across resistor. This wiper is connected to the center pin. The result
is that the resistance between the center pin and either one of the ends can be
changed by rotating the shaft.
 The
rotation of the shaft is usually limited so that the wiper does not turn past
either end of the carbon film.
The
rotation of the shaft is usually limited so that the wiper does not turn past
either end of the carbon film.
 The
electrical symbol for a pot captures this idea. It shows a fixed resistor with
an arrow touching it. The arrow can move up and down the resistor.
The
electrical symbol for a pot captures this idea. It shows a fixed resistor with
an arrow touching it. The arrow can move up and down the resistor.
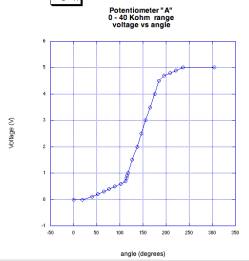
Any pot can be used as a rotation sensor. If 0 V is applied to one end of the pot and 5 V to the other, then the voltage at any point on the resistor varies between 0 V and 5 V. Depending on how the shaft is turned, it will pick up different voltages. This means that the voltage on the center pin will depend of the rotation of the shaft. This why we can call a pot a rotation sensor, even though that is not its usual designation! Note that it is limited to less than one rotation. It could not be used to measure
An ideal pot for rotation sensing would be exactly linear; the voltage would increase uniformly as the shaft was rotated from one stop to the other. Some pots are made this way; they are said to have a “linear taper.” Unfortunately, the pots in the ITSI kit are not linear as the graph above shows. There are actually five linear regions. This fact restricts the utility of this pot. The ISTI pot is best used as a rotation sensor when it is restricted to the central linear region. Within that region, it is very sensitive, changing 3 V in about 50° of rotation. That works out to be 1/60 of a degree (a minute of rotation) for each mV.
pot can be used as a support and pivot for a pendulum while also measuring the angle that the pendulum makes. Just be sure that the pot reads 2.5 V when the pendulum is hanging straight down and do not displace it more than 30° either way.
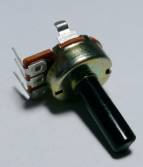 The ITSI pot can be plugged directly into the
experiment board. Before doing this, bend the hook-shaped tabs out of the way.
They are used to attach the pot firmly to circuits, but serve no electrical
function.
The ITSI pot can be plugged directly into the
experiment board. Before doing this, bend the hook-shaped tabs out of the way.
They are used to attach the pot firmly to circuits, but serve no electrical
function.
To connect the pot to your computer make the following
connections, but first disconnect the header from
the GoLink.
- Connect on of the outside pins on the pot (it does not matter which) to GND (ground) on the header. This is the second from the top of the header if you hold the header so you can read the lettering.
- Connect the other outside pin on the header to +5 V on the header. This is the second from the bottom on the header.
- Connect the center pin of the pot to SIG1, the signal input in the header. This is the bottom connector on the header.
Check your connections. When you are sure that you have it right, plug the
header into the GoLink and the GoLink into a USB port on your computer. Then
run one of the ITSI activities that reports raw voltage or rotation.
In the photo above, note that a short Experiment board is used and red lines have been drawn around the header. The Experiment board has been cut down so that the rotation circuit can be left if place while other pieces of the board are used for other circuits. The red lines show where to place the header, which must be shared between circuits.
Other Three-Wire Sensors
Just for reference, you should know that there are other three-wire sensors that were too expensive for the ITSI kit, but are still much more economical than purchasing commercial probes. These include sensors for acceleration, pressure, and humidity. In each case, the sensor contains a sophisticated circuit that greatly simplifies the electronics. They are relatively inexpensive because they are mass-produced for consumer applications. For instance, the accelerometer is used in automobile air bags. Pressure sensors are used in hospitals and disposed after use to avoid contamination. The humidity sensor is widely used to sense wet conditions that might ruin circuits.
The TDK relative humidity sensor
Here's the circuit:
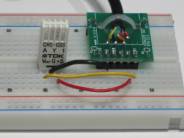 Graphs
were made by breathing in and out across the sensor.
Graphs
were made by breathing in and out across the sensor.
CHS-MSS (the cheaper one - about $15), claims range of 20 to 80% RH. Voltage is equal to RH
 CHS-GSS
(a few dollars more). Claims range is 5 to 95%.
CHS-GSS
(a few dollars more). Claims range is 5 to 95%.
Section 7:
Experiments with Three-Wire Probes
Temperature
[Coming.]
Map the Magnetic Field
 In
this experiment, the magnetic field detector is used to map the magnetic field
of the magnet provided in the ITSI kit.
In
this experiment, the magnetic field detector is used to map the magnetic field
of the magnet provided in the ITSI kit.
First, put the sensor on a flexible extension. One way of doing this is shown below. The three wires act as an extension cord for the sensor, attaching to a small board cut from the Experiment board. The Hall Effect sensor is attached to the satellite board and bent over.
Tape the magnet to a piece of paper. Trace the field lines on the paper. Place the sensor at different locations and twist the sensor until it detects NO field. Make a short line at this point that is parallel to the flat part of the sensor.
You can tell that there is no field when the value read by the computer is the same as when the detector is far away from the magnet.
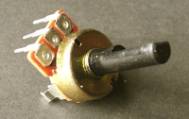 The reason for looking for no field is that
the sensor detects only the component of the magnetic field that goes through
the sensor from back to front. It cannot detect field that goes sidewise
through it.
The reason for looking for no field is that
the sensor detects only the component of the magnetic field that goes through
the sensor from back to front. It cannot detect field that goes sidewise
through it.
A Pendulum
[Coming.]
 Section 7: Half-Bridge Circuits
What is a Half-Bridge?
A half-bridge is simply a fancy name for two electrical components in series between power and ground. All our half-bridges will have the circuit at right. The sensor passes a current I which develops a voltage Vout by passing though the resistor R. This generates a voltage Vout = IR.
If the current is proportional to the physical input, then the output voltage Vout will also be proportional. This voltage can be fed into the computer through the GoLink.
The ITSI kit has two sensors that will be used with this circuit, the phototransistor and the foam force sensor. The circuit will also be used to measure galvanic skin response, or GSR.
Measuring Light with the Phototransistor
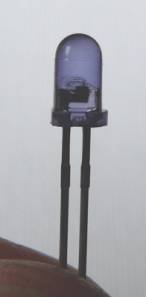
 A
phototransistor is a sensitive detector of light. That vertical line in the
symbol at right is called the base. For every photon of the right energy that
lands on the base, a hundred or so electrons can flow through the transistor.
The conventional current flows in the direction of the solid arrow, although
electrons are flowing in the opposite direction. Almost no current can flow unless
the base is illuminated.
A
phototransistor is a sensitive detector of light. That vertical line in the
symbol at right is called the base. For every photon of the right energy that
lands on the base, a hundred or so electrons can flow through the transistor.
The conventional current flows in the direction of the solid arrow, although
electrons are flowing in the opposite direction. Almost no current can flow unless
the base is illuminated.
If there is 2 V or more applied to the top lead (the collector) relative to the lower lead (the emitter), the current flowing is proportional to the light.
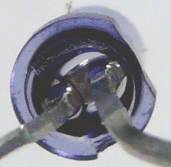 You have to use the right leads, or nothing
will happen. In the close-up photograph below, you can see a flat side on the
ring of plastic (the flange) that encircles the bottom of the sensor. The flat
is nearest the lead that must be more positive.
You have to use the right leads, or nothing
will happen. In the close-up photograph below, you can see a flat side on the
ring of plastic (the flange) that encircles the bottom of the sensor. The flat
is nearest the lead that must be more positive.
The rounded top of the phototransistor acts like a lens. Because of this, it is very directional. The rounded end of the phototransistor must be aimed within 5° of a light source.
Phototransistors are most sensitive at 840 nm, which in the near infrared. They do, however, have significant response from 400 nm (violet) through the entire visible range (which ends around 750 nm) to 1000 nm.
 The
complete light detector circuit is shown at right. The size of the resistor R determines
the useful light range. For sunlight and very bright lights, use a 10 kΩ
resistor for R. For indoor use and situations that need more sensitivity, use a
100 KΩ resistor.
The
complete light detector circuit is shown at right. The size of the resistor R determines
the useful light range. For sunlight and very bright lights, use a 10 kΩ
resistor for R. For indoor use and situations that need more sensitivity, use a
100 KΩ resistor.
The circuit can be constructed next to the header without wires. First, disconnect the header from the GoLink. Then follow these steps:
- Insert the phototransistor with its positive lead attached to +5 V and the other to SIG1. These are next to each other at the lower end of the header.
- Connect SIG1 to GND using a 100 kΩ resistor. SIG1 is the last lead on the bottom of the header and GND is second from the top.
That’s all there is to it! Check your connections. When you are sure that you have it right, plug the header into the GoLink and the GoLink into a USB port on your computer. Then run one of the ITSI activities that reports raw voltage or light level. If nothing happens, try reversing the leads on the phototransistor.
With the 100 kΩ resistor, this circuit should be very sensitive to light. For outside use, you might use a smaller resistor, such as 10 kΩ. For greater sensitivity, you can use a 1 MΩ resistor. Substitute the pot for the resistor to give variable sensitivity. Use the circuit in the next section, except swapping the phototransistor for the foam force detector.
For the more technically—oriented, this is an OPTEK OP505C NPN silicon photransistor or equivalent.
Measuring Force with Conductive Foam
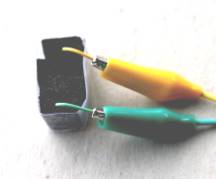 It has been a challenge to come up with an
inexpensive force detector for the ITSI kit. We have settled on an approach
that is inaccurate but inexpensive. In the spirit of “do-it-yourself,” you make
your own force sensor from the black conductive foam that comes with the kit.
It has been a challenge to come up with an
inexpensive force detector for the ITSI kit. We have settled on an approach
that is inaccurate but inexpensive. In the spirit of “do-it-yourself,” you make
your own force sensor from the black conductive foam that comes with the kit.
This foam conducts current better when it is squeezed. Use your ingenuity to create a force detector based on this idea. We made the detector below by cutting several pieces of foam to form a stack and then put tape around the stack to hold it together. Finally, we inserted bare wires into the top and bottom of the stack.
Construct your own stack and check its resistance using the DMM. The resistance should be too large to measure when no force is applied. When you squeeze it, the resistance will drop to 10 kΩ or less.
The schematic diagram for this circuit is a half-bridge that converts the resistance change of the foam block into a voltage that the GoLink can measure.
There is no established symbol for the foam stack, so we have used a conventional symbol for any variable resistor, a resistor with a diagonal arrow through it.
 Because
the resistance of the foam changes a great deal, it is a good idea to use the
100 kΩ pot for the R in the half-bridge circuit. Just use two of the connectors
to the pot–the center one and one of the ends. The third lead does not need to
be connected.
Because
the resistance of the foam changes a great deal, it is a good idea to use the
100 kΩ pot for the R in the half-bridge circuit. Just use two of the connectors
to the pot–the center one and one of the ends. The third lead does not need to
be connected.
A photograph of the completed circuit is shown below. The two clip leads connect to the foam block, which is not shown.
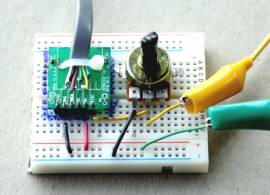 It is as simple as that! Check your connections.
When you are sure that you have it right, plug the header into the GoLink and
the GoLink into a USB port on your computer. Then run one of the ITSI
activities that reports raw voltage. Turning the shaft of the pot should change
the responsiveness of the circuit to force on the sensor.
It is as simple as that! Check your connections.
When you are sure that you have it right, plug the header into the GoLink and
the GoLink into a USB port on your computer. Then run one of the ITSI
activities that reports raw voltage. Turning the shaft of the pot should change
the responsiveness of the circuit to force on the sensor.
As you experiment with your circuit, see whether you can discover the extent of its limitations: it is non-linear, it drifts, and it has hysteresis. “Non-linear” means that what you see on the computer output is not proportional to the applied force. “Drift” means that a constant force can result in a changing signal. “Hysteresis” means that it shows the effect of its recent history—if you measure a voltage due to one force, apply a greater force and then return to the original force, the voltage will not return to the original value. The non-linearity can be compensated with calibration, but not drift and hysteresis. All this means that using foam to detect force is a cute demonstration, but not a very useful instrument.
Measuring Galvanic Skin Response
Galvanic skin response (GSR) is an old-fashioned term for the change of electrical resistance of the skin due to emotional responses that cause sweating. The term “galvanic” comes from a sensitive analog current meter called a galvanometer that was used in the 19th century to measure this effect. Just to confuse things, GSR is also known as electrodermal response (EDR), psychogalvanic reflex (PGR), or skin conductance response (SCR). We’ll stick with the historical “GSR.”
 The
“sensor” in this case is your skin, or your subject’s. The half-bridge can be
used to create a voltage, which will be proportional to skin resistance.
The
“sensor” in this case is your skin, or your subject’s. The half-bridge can be
used to create a voltage, which will be proportional to skin resistance.
It is sometimes a challenge to make good electrical contact with the skin, particularly for people with dry skin. The photograph to the left illustrates one solution to this problem. A strip of aluminum foil has been taped to each finger. Leads are clipped to the foil. To make a really good electrical connection, make a paste consisting of a small amount of skin moisturizer mixed with salt. Apply a small amount of this between the foil and skin.
This circuit can be constructed like the phototransistor circuit, connecting directly to the header. Start by disconnecting the header from the GoLink. Then follow these steps:
- Connect one finger to +5 V, the next-to-bottom terminal on the header, when held so that the lettering is right side up.
- Connect another finger to SIG1 on the header, the bottom terminal.
- Connect a 100 kΩ resistor between SIG1 and GND, the second from top terminal on the header.
 Because you are connecting to a person, take every
precaution. The major hazard would originate in a fault in the computer you
use. If there is a frayed wire inside its power supply or external transformer,
it is possible that 110 VAC from the power could find its way to any metal on
the computer and to the USB port that you are using. This is highly unlikely,
but you should always be aware of this possibility. If you pass your finger
over metal parts of the computer and feel a light vibration, it could indicate
a problem. Have a professional check out your computer.
Because you are connecting to a person, take every
precaution. The major hazard would originate in a fault in the computer you
use. If there is a frayed wire inside its power supply or external transformer,
it is possible that 110 VAC from the power could find its way to any metal on
the computer and to the USB port that you are using. This is highly unlikely,
but you should always be aware of this possibility. If you pass your finger
over metal parts of the computer and feel a light vibration, it could indicate
a problem. Have a professional check out your computer.
It is a good precaution to avoid any unanticipated path for electrical current from the leads you attach. Any problem with your computer’s power supply can be dangerous only if current goes through your or your subject’s body. This cannot happen if there is no other connection to the computer, the AC power lines, or the earth. It takes a completed circuit to cause a problem, so be sure that you and your subject are not touching any metal or water.
Only when you are 100% sure that every precaution has been taken, connect the header to the GoLink, the GoLink to a USB port, and run a ITSI program that graphs raw voltage data. It is surprising how much the voltage can change in response to emotion. Try to embarrass the subject, or get him/her to tell a lie. A surprise kiss will send the voltage soaring! Another anxiety creator is to blindfold the subject and throw cotton balls at their face at irregular intervals. Taking a picture of a subjects is effective, too.
Section 8: Amplifier
Circuits
There are many situations in which the electrical signals are too small for the GoLink interface to detect. This happens for some sensors or when greater sensitivity is needed. This section shows how a simple but powerful amplifier can be built for the thermocouple and magnetic field sensor. It also contains a circuit for amplifying small currents, such as those generated by a LED when used to detect current.
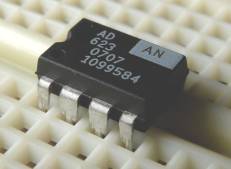 Voltage Amplifiers
A voltage amplifier is needed when you have a small voltage signal that must be made larger.
The photograph at right shows the amplifier that is supplied with the ITSI kit. It is a tiny, inexpensive integrated circuit (or IC or chip). It is made by Analog Devices and they call the AD623AN. Do you see those numbers and letters on your chip? The rest of the numbers are meaningful only to Analog Devices.
This chip is classified as an “instrumentation amplifier” or i-amp, for short. As the name implies, this kind of amplifier is frequently used in instruments. It amplifies the difference between two inputs by a factor called the gain, which can be set between 1 and 1000. It can be powered by connecting it to +5 V and ground. When powered this way, its inputs can be any voltage between 0 V and 3.5 V and it can generate an output over almost the entire 0-5 volt range. Its inputs draw almost no current (25 nA at most), making them very good voltage sensors.
The output voltage can be offset so that if there is no difference in the inputs, the output voltage will be the offset voltage. This is handy when the input voltage difference might be positive or negative. Without the offset, if the input difference was negative, the amplifier would try to generate a negative output voltage, which it cannot do if it is powered by 0 V and 5 V.
The gain of the i-amp is determined by a resistor connected between two pins on the chip. The gain G is set by the resistor value R, based on the following equation:
G = 1 + 100,000/R
R is permitted to be as small as 100 Ω, in which case the gain formula says that the gain is 1,001, or approximately 1,000. If there is no resistor, this is equivalent to an infinite resistance, and this equation says that the gain will be 1. Stated differently, leave out the resistor and the amplifier will work and give a gain of one. This may not sound useful, but it finds applications when whatever is providing the input cannot supply much current or when its ability to measure the difference of two signals is important.
There are eight pins on the AD623. Like all integrated
circuits, there is an identifier for pin 1 and the other pins are numbered from
there counter-clockwise as you look down at the chip. For the AD623 there are
two indicators for pin 1 that you can see in the photo at right. There is a
notch in the end where pin 1 is, and there is a circular indent  or
dot above pin 1.
or
dot above pin 1.
The pins have the following functions.
- Pins 7 and 4 provide the power for the internal circuit. Connect pin 4 (called –Vs) to ground and pin 7 (called +Vs) to +5 V. When assembling a circuit with any sensitive component like the AD623, always attach ground first.
- Pins 1 and 8 are for the “gain programming” resistor. A resistor with value R in the equation above sets the gain. The ends of the resistor are attached to these pins.
- Pins 2 and 3 are the voltage inputs, whose difference is calculated by the chip to determine the output. Pin 2 is called “–IN” because an increase in its value decreases the output. Pin 3 is called “+IN” because and increase in its value increases the output.
- Pin 5 is REF, the reference or offset voltage
- Pin 6 is the output voltage. It obeys the following equation:
OUTPUT = G [(+IN) – (–IN)] + REF
In words: the output voltage is the difference in the two input voltages multiplied by the gain G and offset by REF.
Example: Thermocouple
The ITSI kit includes thermocouple wire that can be used to sense small temperature differences, but only generates a for each degree difference. A voltage amplifier is needed to multiply this signal by 1,000 before the interface can detect it.
 When
any two different metals touch, there is a tiny voltage difference between
them. This is called the Seebeck voltage. Furthermore, this voltage difference
changes slightly as the temperature of the junction changes. This difference
can be used to make a very inexpensive but useful temperature sensor.
When
any two different metals touch, there is a tiny voltage difference between
them. This is called the Seebeck voltage. Furthermore, this voltage difference
changes slightly as the temperature of the junction changes. This difference
can be used to make a very inexpensive but useful temperature sensor.
It is easy to imagine that you could measure the Seebeck voltage directly using the circuit shown at right. The thick wires could be copper and the thin one some other metal, such as iron. The junction of these two will generate the Seebeck voltage, but the voltmeter V will not record anything, even if it is very sensitive. Why? This is because there is another junction in this circuit, at A. The junction at A, furthermore, is oriented in the opposite direction from the junction you are trying to read. The effect is just like a tug-of-war contest between two matched groups—the rope goes nowhere. There is no way to avoid this cancellation of the Seebeck voltages around a complete circuit, if all the junctions are at the same temperature.
But if the two junctions are at different temperatures, one will generate a larger voltage. Just like a stronger tug-of-war team can beat out the weaker, there will be a voltage difference that you can measure.
This voltage difference is small, however, only twentieth of a millivolt (52 millionths of a volt, to be exact) for each degree of temperature difference, measured in degrees Celsius. Therefore, you need an amplifier and the AD623 is the perfect choice.
 Start
by making the thermocouple sensor from the wire supplied in the ITSI kit. The
kit contains two strands of very thin wire for making thermocouples. One wire
is made of iron and the other of Constantan, a copper-nickel alloy. The iron
wire looks faintly red due to rust.
Start
by making the thermocouple sensor from the wire supplied in the ITSI kit. The
kit contains two strands of very thin wire for making thermocouples. One wire
is made of iron and the other of Constantan, a copper-nickel alloy. The iron
wire looks faintly red due to rust.
The following describes how to make a thermocouple sensor.
- Cut two lengths of Constantan and one of iron, all about 10 cm (4 inches) long.
- Get rid of oxidation on the last 1 cm of the wires by scraping with a knife or sandpaper. If possible, clean the ends with acid flux used by plumbers.
 Twist
the cleaned ends of one Constantan and one iron wire together tightly using
pliers. All metals form oxide coatings in air. It is essential to get the
metals to touch and not only their oxide coatings. This can be done by
squeezing, folding, and crushing the junction.
Twist
the cleaned ends of one Constantan and one iron wire together tightly using
pliers. All metals form oxide coatings in air. It is essential to get the
metals to touch and not only their oxide coatings. This can be done by
squeezing, folding, and crushing the junction. - Twist the other end of the iron wire to the second Constantan wire. This should make a Constantan-iron-Constantan thermocouple with two junctions.
- If you are able to solder, solder the junctions using the acid flux and as little solder as possible. Soldering is optional, but makes a better junction.
- Slip the shrink tubing “spaghetti” over the thermocouple wire so that only the two junctions and the ends are exposed. You now have a temperature difference sensor.
By the way, the order of metals does not matter. You can reverse the two metals and still get an equivalent thermocouple.
 The photograph above shows the thermocouple
used to measure the cooling of a cup of water. Although not necessary,
different color spaghetti was used for the two different thermocouple metals.
You can see one junction in the water. The other junction is inside a ball of
clay. The clay stabilizes the temperature of one junction so it can act as a
reference. Remember, the thermocouple measures the difference of the
temperature of the two junctions. The clay helps keep one junction at a
constant temperature (approximately) so that any changes observed are due to
temperature changes at the other junction.
The photograph above shows the thermocouple
used to measure the cooling of a cup of water. Although not necessary,
different color spaghetti was used for the two different thermocouple metals.
You can see one junction in the water. The other junction is inside a ball of
clay. The clay stabilizes the temperature of one junction so it can act as a
reference. Remember, the thermocouple measures the difference of the
temperature of the two junctions. The clay helps keep one junction at a
constant temperature (approximately) so that any changes observed are due to
temperature changes at the other junction.
The circuit at right uses the AD623 to amplify the Seebeck voltage into a range that can be sent to the computer by the GoLink. This circuit has a gain of 1,000 set by the 100 Ω resistor, and an offset of 2.5 V set by the pair of 10 kΩ resistors. (If you don’t have these resistors, any matched pair from 1 kΩ to 100 kΩ can be substituted.)
To construct this circuit, following these steps.
- Disconnect the header from the GoLink
- Connect pin 4 of the AD623 to GND on the header. This grounds the circuit.
- Connect pin 7 of the AD623 to +5 V on the header. This provides power to the internal circuit.
- Connect a 100 Ω resistor between pins 1 and 8 of the AD623. Do this neatly by shortening the leads of the resistor and covering them with spaghetti. This programs the AD623 for a gain of 1,000.
- Connect the thermocouple to pins 2 and 3 of the AD623. You can make this connection by inserting short wires into the Experiment board and then attaching clip leads between them and the thermocouple. These are the inputs to the amplifier.
- Connect one 10 kΩ resistor between GND and pin 5 of the AD623. Again, shorten the leads and cover any exposed parts with spaghetti. This is one arm of a half-bridge voltage divider that generates a 2.5 V output offset.
- Connect the second 10 kΩ resistor between +5 V and pin 5 of the AD623. This completes the half-bridge voltage divider.
- Run a wire from pin 5 to pin 2 of the AD623. This holds the inputs near 2.5 V. Without this, they could drift to 0 V or 5 V and exceed the input voltage spec.
- Connect pin 6 of the AD623 to SIG1 on the header. This connects the output of the amplifier to the GoLink input.
That’s all that is required to create a very sensitive temperature difference probe. Check your wiring carefully and be sure that no bare leads can touch. Attach the header to the GoLink and connect that to a USB port. Run the raw voltage graphing software. You should see a small signal on top of a 2.5 V offset. A 50 mV (0.05 V) change corresponds to one degree. The graph can easily show temperature changes of 0.2°C, corresponding to a voltage change of 10 mV or 0.01 V.
In general, if the temperature changes by ∆T, you will observe a voltage change of ∆V given by
∆V = G(52x10-6) ∆T
where G is the gain of the circuit. In the circuit shown, G = 1000 so this reduces to
∆V = .052*∆T
Solving for ∆T gives approximately
∆T = 19∆V
The change in temperature will be approximately 19 times the change of voltage that you measure with this circuit.
(This is a nice application of Algebra I.)
The thermocouple can be used to measure very high temperatures, such as those found in a flame. For these applications, the gain of the circuit shown may be too large. To reduce the gain, replace the 100 Ω resistor with a 1 kΩ resistor to give a gain of 100 making the equation
∆T = 190∆V
You should see that heating one junction causes the voltage to go up, and the other causes the temperature to go down. This second one is often called the reference junction. Put clay on the reference junction and use the other to measure temperatures.
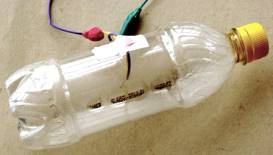 If you set the graph vertical scale so that
small variations from the offset can be seen, you should see that the sensor
responds very quickly to small temperature changes. You can put one junction
near your nose and detect the temperature difference between breathing in and
breathing out. In still air you can even detect warmer air rising from your
hand!
If you set the graph vertical scale so that
small variations from the offset can be seen, you should see that the sensor
responds very quickly to small temperature changes. You can put one junction
near your nose and detect the temperature difference between breathing in and
breathing out. In still air you can even detect warmer air rising from your
hand!
The photograph at left and data below show another nice application of the thermocouple. One junction has been sealed into to a closed plastic bottle using hot glue. It is right in the center of the bottle, in contact with only the air. When the bottle is squeezed, the temperature goes up within two seconds. When the force is released, the temperature drops.
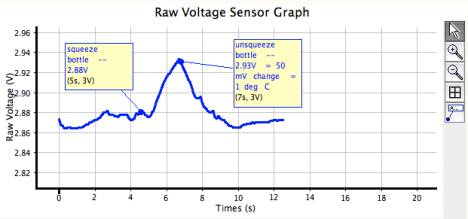
Example: Small Magnetic Fields
[Coming]
 Current-to-Voltage Amplifiers
+5V
Some sensors such as the phototransistor generate a current
rather than a voltage. In section seven, we converted the current into voltage
by passing it through a resistor. If the sensor does not generate a large
current, however, simply using a resistor is ineffective. An amplifier that amplifies
the current and turns it into a voltage is needed. This is a current-to-voltage
(I-to-V) amplifier.
For this application, ITSI uses an operational amplifier, or op-amp. This amplifier got its name because it can be used to perform many different operations—making an I-to-V amp is only one of its many tricks.
The op-amp circuit is shown above. The triangle represents the op-amp. Its inputs are on the left and the output is on the right. The gain of the opamp is huge, typically a million times that difference of the inputs. The gain is so much that an opamp must always be used with negative feedback The resistor R that connects the output to the inverting input provides this feedback. This simple circuit is very sensitive to a current supplied into the upper connection. If a reference voltage Vref is supplied, the output voltage will be
Vout = Vref – IR.
The value of the resistor R determines how sensitive this is. A very large resistor can be used—100 kΩ, 1 MΩ, or even 10 MΩ. Using a 1 MΩ resistor means that the output changes one volt for each microamp change in the input. Since the computer can detect a change of one mV, this means that changes as small as a 1 nanoamp (10-9 A) can be detected!!
Example: LED as Detector
A light emitting diode (LED) is primarily used as a light source, but it can also be used as a detector and its output is a weak current. LEDs are only about 1/100 as sensitive as the phototransistor, but they have another value—they are sensitive to fewer wavelengths of light.
 The
graph at right shows the emission and detection sensitivity for a green LED.[4]
The narrow curve on the right is the emission spectrum. The broader line on the
left shows what wavelengths it can be used as a detector. For reference,
visible light wavelengths go from violet at 480 nm to deep red at 700 nm. The
green LED emits in the yellow-green and detects about 30 nm shorter
wavelengths, a blue-green.
The
graph at right shows the emission and detection sensitivity for a green LED.[4]
The narrow curve on the right is the emission spectrum. The broader line on the
left shows what wavelengths it can be used as a detector. For reference,
visible light wavelengths go from violet at 480 nm to deep red at 700 nm. The
green LED emits in the yellow-green and detects about 30 nm shorter
wavelengths, a blue-green.
 The
op-amp we will use is called a TLC272.[5]
This chip actually contains two op-amps—we will use just the first. Use the
green LED; its symbol is the arrow and vertical straight line. We have found
that the green LED is better for visible light.
The
op-amp we will use is called a TLC272.[5]
This chip actually contains two op-amps—we will use just the first. Use the
green LED; its symbol is the arrow and vertical straight line. We have found
that the green LED is better for visible light.
This circuit applies “reverse bias” to the diode—the voltage applied tries to pass current in the direction opposite the current that lights up the diode. No current will flow unless light falls on the LED. The output should be around 2.5 V and increase by IR, where I is the current caused by light.
Section 9:
Calibration
[Coming]
Overview
Linear Probes
Non-Linear
Section 10: Noise
Reduction
What is Noise?
Electrical noise comes from unwanted electrical signals that sneak into circuits. You do not want noise because it can mask the signal you are trying to measure. In many situations, it is noise that limits what you can measure, particularly when the signal is small. Noise can be very frustrating. If try to amplify a small signal, you not only amplify any noise present in the signal, but the amplifier itself can add noise as well.
In ITSI, we have tried to create circuits for which noise is not much of a problem. For the circuits in this guide, you will probably see noise only if there is a problem with the circuit or one of the components. If you strike out on your own, you may encounter noise if you try to get too much gain.
Keeping Noise Out
One of the reasons that electrical components are often encased in metal is to make it more difficult for noise to get in. The single most common source of electrical noise is the 110 VAC electrical power that is everywhere. The wires in the wall, transformers in substations, and high-voltage wires all hum at 60 Hz (or 50 Hz in much of Europe), generating alternating electro-magnetic fields that can find their way into sensitive sensors. The solution is simple—encase everything in metal. An electric field cannot penetrate a conductor. That’s why the Experiment board comes with a metal back—even though it is only on one side, it makes it more difficult for stray fields to get at your circuits.
The RC Filter
 If
you cannot keep the noise from getting into a circuit, there are tricks to
getting rid of it. One of the most common tricks is to separate your signal
from noise on the basis of frequency. If your signal is one frequency and the
noise another, then you need a circuit that blocks the unwanted frequency—a
filter.
If
you cannot keep the noise from getting into a circuit, there are tricks to
getting rid of it. One of the most common tricks is to separate your signal
from noise on the basis of frequency. If your signal is one frequency and the
noise another, then you need a circuit that blocks the unwanted frequency—a
filter.
A capacitor is critical to creating a filter. A capacitor has a remarkable property—it can pass high frequency currents and block low frequency ones. A capacitor can be thought of as a frequency-dependent resistor. It has little resistance to high frequency signals but high resistance to low frequencies. See p. 13 for more information about how a capacitor works.
The circuit at right is a simple filter, looking a lot like a half-bridge. It is called a low-pass filter. It blocks high frequency signals and passes low-frequency ones.
If you apply an alternating voltage at Vin with a frequency f, then the output voltage, measured at Vout will depend on the frequency. Half of the input voltage will appear at Vout when the frequency is
fc = 1/(2πRC)
 This
is the critical frequency. Higher frequencies are blocked and lower ones pass
right through. You can select values of R (in ohms) and C (in Farads) to set
the critical frequency to be anything you like.
This
is the critical frequency. Higher frequencies are blocked and lower ones pass
right through. You can select values of R (in ohms) and C (in Farads) to set
the critical frequency to be anything you like.
At right is a high-pass filter that is the first cousin to the low-pass one. It has the same critical frequency, but blocks lower frequencies passes higher ones.
Both circuits are called RC filters because the numerical product RC appears in the formula and because they consist of simply one resistor and one capacitor.
It is important to realize that these are far from perfect filters—they pass many unwanted frequencies, but they do knock them down. Far better circuits are available, but that goes beyond what is needed in ITSI.
Example: The Motion Detector
It is uncommon to use a motor as a detector because the motor generates electrical noise. Inside the motor there are electrical contacts that connect to the rotating coils. As the motor turns, the contacts slide across one another and this always generates high frequency noise. We can get rid of this noise with a low-pass filter.
The value of the produce RC needs to be selected to pass just the frequencies we want. This raises the question: what frequencies do we want? It may be unfamiliar to think of a signal as having frequency, but it will. Only a steady signal has zero frequency and that is not very interesting. If you start and stop the motor, you will be generating a signal that has low frequencies. The faster you start and stop it, the higher the frequency. Roughly, if you want to record features of the signal that occur in time t or longer, then you need to pass frequencies equal to 1/t or lower. So, 1/t is the critical frequency fc. Using the equation for critical frequencies, this means that
t = 2πRC
Stated another way, we need the product RC to equal
RC = t/(2π) or approximately t/6
We can approximate (1/2π) as 1/6 because the filter is not very sharp anyway. We just need to get into the right range.
For our motion experiments with the motor, we need to be able to see events that happen in a fraction of a second. If we choose t = 0.1 sec then events that happen at a tenth second or slower will be recorded. We will build the circuit and see whether that is sufficient to knock out the noise that the motor generates. Substituting 0.1 into the last equation tells us that we need
RC = .016 (approximately) or
R = .016/C
In these equations, R is measured in ohms and C in Farads. The ITSI kits do not all have the same capacitors, so it is up to you to find a suitable RC pair.
For example, one of the capacitors supplied to some kits is 47 µF or 47x10-6 F. Substituting this into the equation gives 340 Ω. Given how broad the RC filter is, any resistor three times and one-third this value would be satisfactory.
To simplify these calculations, we have prepared the following table for various capacitors found in ITSI kits. The table lists the precise value of R given by the equation for a 0.1 sec response, close resistance values that are found in ITSI kits, and an acceptable range.
|
C (µF) |
R (Ω) |
Best R values (Ω) |
Acceptable range (Ω) |
|
220 |
72 |
47, 100, 120 |
22 to 220 |
|
100 |
160 |
100, 120, 220 |
47 to 470 |
|
47 |
340 |
220, 390, 470 |
100 to 1 kΩ |
|
33 |
480 |
390, 470, 1 kΩ |
150 to 1.5 kΩ |
|
22 |
720 |
470, 1 kΩ, 1.2 kΩ |
220 to 2.2 kΩ |
|
10 |
1600 |
1.2 kΩ, 2.2 kΩ |
470 to 4.7 kΩ |
|
4.7 |
3400 |
2.2 kΩ, 3.9 kΩ, 4.7 kΩ |
1 kΩ to 10 kΩ |
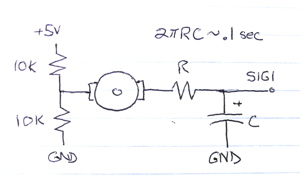
The circuit at right shows the complete sensor-motor circuit. It consists of a half-bridge on the left to give a 2.5 V offset and an RC filter on the right to knock out the noise.
Other paired resistors can be substituted for the half-bridge pair of 10 kΩ resistors, but use only ones smaller than the R you select.
Read the capacitance value C of your capacitor and find a suitable R using the table above. These will be the R and C in the circuit.
When you connect to the computer, and run a raw voltage grapher, you should see a signal offset to about 2.5 V. Spinning the motor should generate a signal that rises or falls about one volt, depending on the direction that you spin it. The photograph on the next page shows the completed circuit.
 By
attaching a pinwheel to the motor, you can create a wind speed sensor. Typical
raw voltage data are shown below.
By
attaching a pinwheel to the motor, you can create a wind speed sensor. Typical
raw voltage data are shown below.